NLP · Quantitative finance
Bitcoin sentiment analysis with LLM embeddings
Using raw tweet embeddings (not scalar sentiment scores) to recover a geometric “market sentiment axis” that correlates with forward BTC direction, plus confidence thresholding and walk-forward validation.
LLM embeddings are 1536-dimensional vectors that describe a word or series of characters using weights that the model has learned to associate with that series of characters. These weights don't describe specific words but rather abstract concepts.
Usually when extracting sentiment from media data, researchers use lexicons that score media as positive or negative based on the presence of bullish or bearish words. Some studies have gone further by passing media directly to language models and asking them to output a scalar sentiment score. Raheman et al. (2022) benchmarked over 21 such models against each other, including lexicon-based approaches and BERT-based classifiers, finding wide variation in performance across cryptocurrency-specific text. This is typically much more accurate than a pure lexicon system, but still loses semantic value. The model's rich internal representations get compressed into just a handful of output tokens conveying a sentiment score, rather than preserving the full geometric depth of what it learned about the input, and the nature of the specific type of sentiment we are interested in.
To eliminate this loss, in this paper we stop at the first stage, using only raw embeddings of tweets to find trends that emerge when relating vectors to Bitcoin price data.
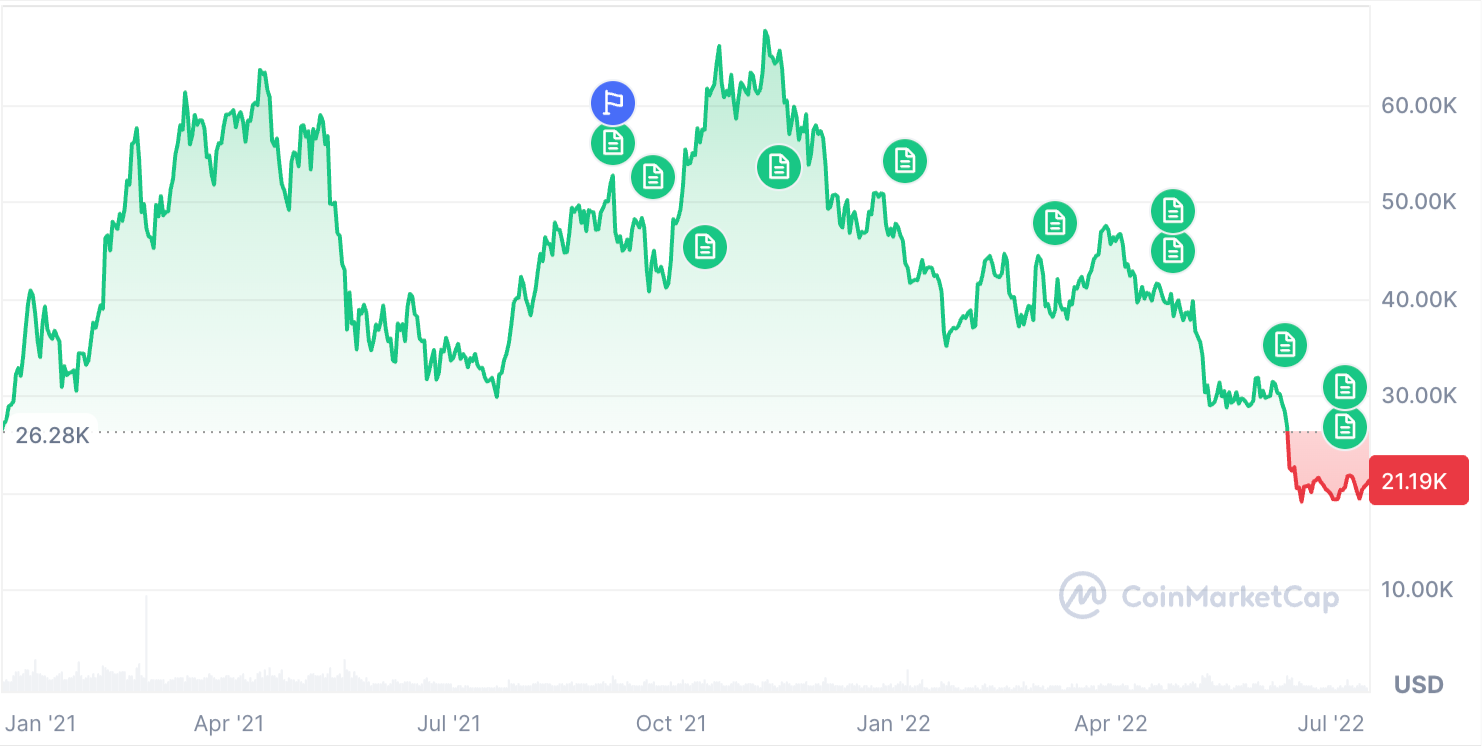
22.8 Million tweets from January 1, 2021 to June 30, 2022 mentioning bitcoin or BTC were embedded, and averaged into a single 1536-dimensional vector representing the average of that hours’ conversation. Then PLS regression with bitcoin price data can produce a new embedding token made up of the true bitcoin market sentiment axis represented by 1536 abstract themes that collectively follow the movement of bitcoin price the best.
Results:
The model used 80% of the data for training and 20% for testing. Then the accuracy of the n=3239 test tweet windows is calculated based on the following 4 hours after the test tweet from hour ‘T’. If the average of the price at [T+1, T+2, T+3, T+4] is more than the price at time ‘T’, then the model successfully predicted the market direction.
The model achieved a raw 52.7% accuracy and a 99% confidence that the true accuracy is between 50.4% and 54.9%. The signal is minimal but significant.
It is important to note that the result given by the regression model for each tweet’s sentiment score is a float, so each tweet that was deemed “positive sentiment” is not equal in signal strength. When we bin each percentile of sentiment score, an extremely consistent pattern emerges:
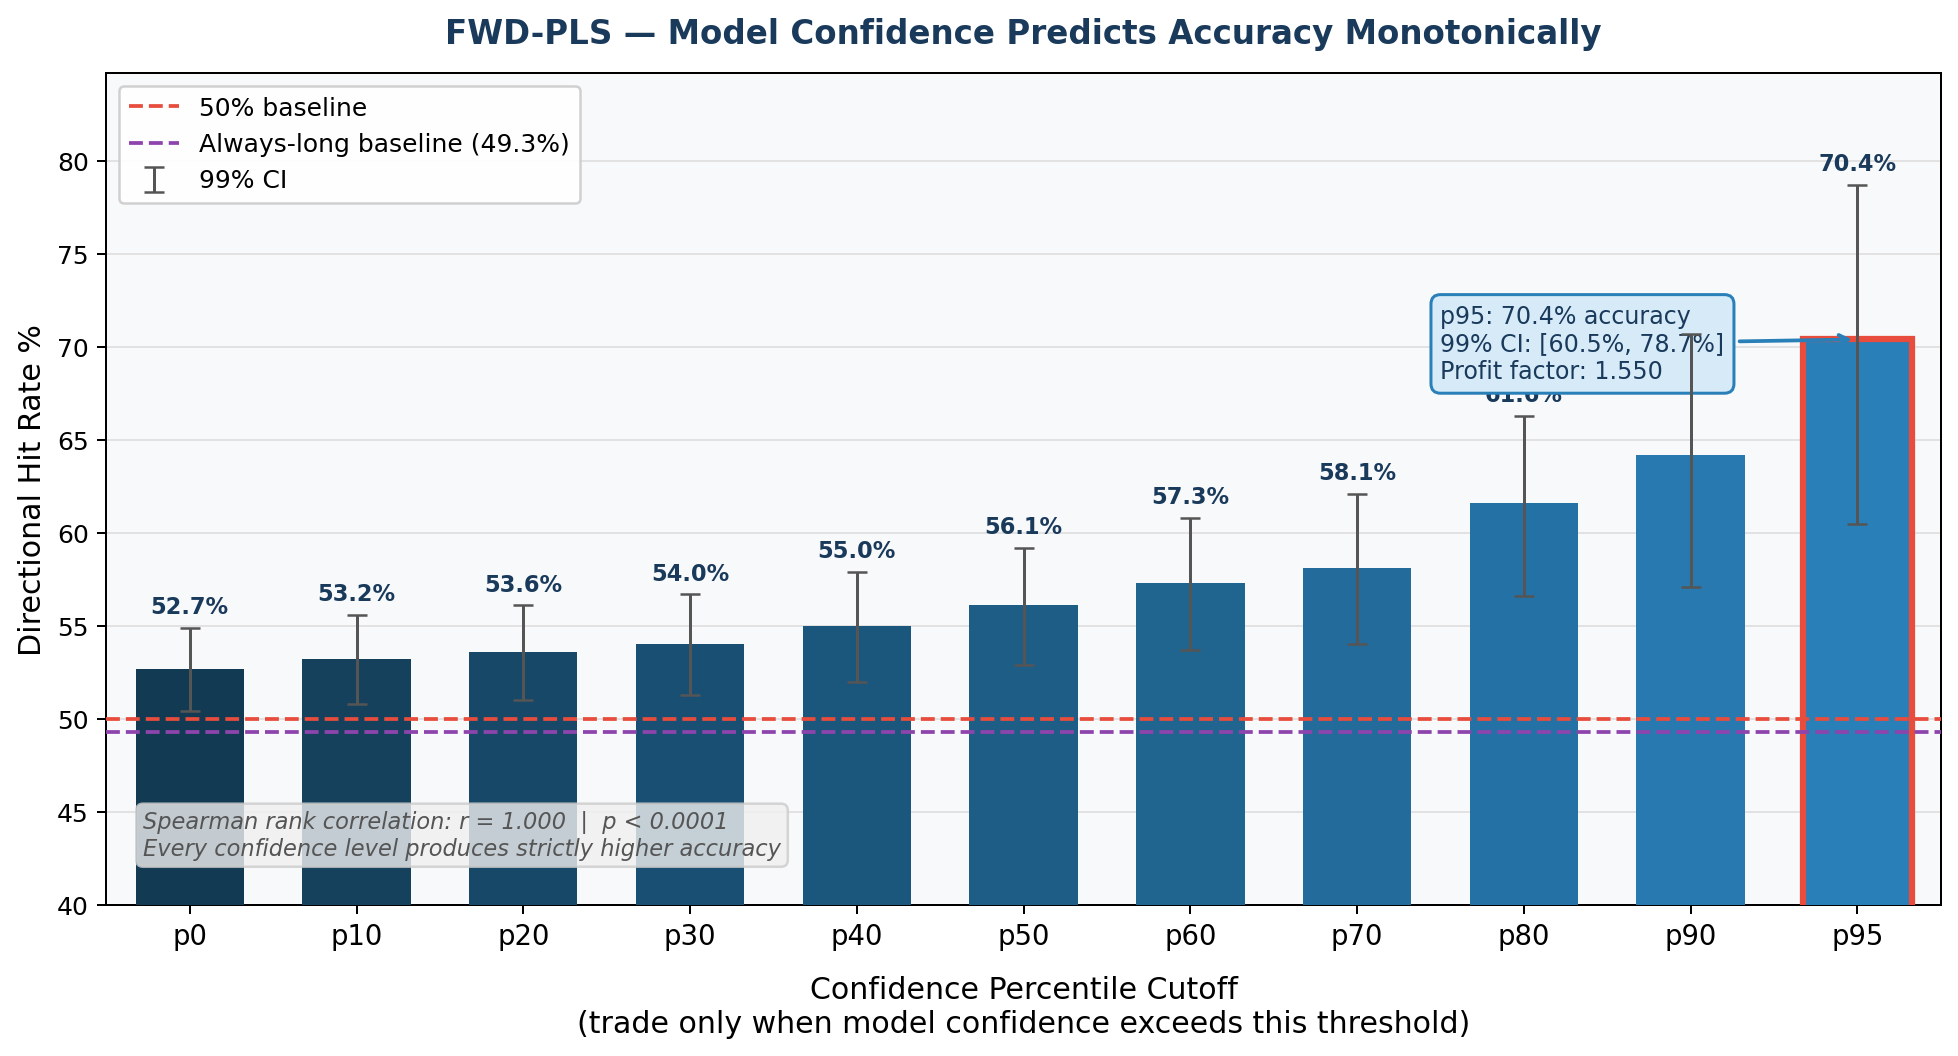
Every 10% percentile increase in confidence score yields exponentially higher accuracy than the last. Discarding the bottom 95% of confidence scores (roughly >0.003), raises the accuracy dramatically to 70.4% with a 99% confidence interval of 60.5% to 78.7%.
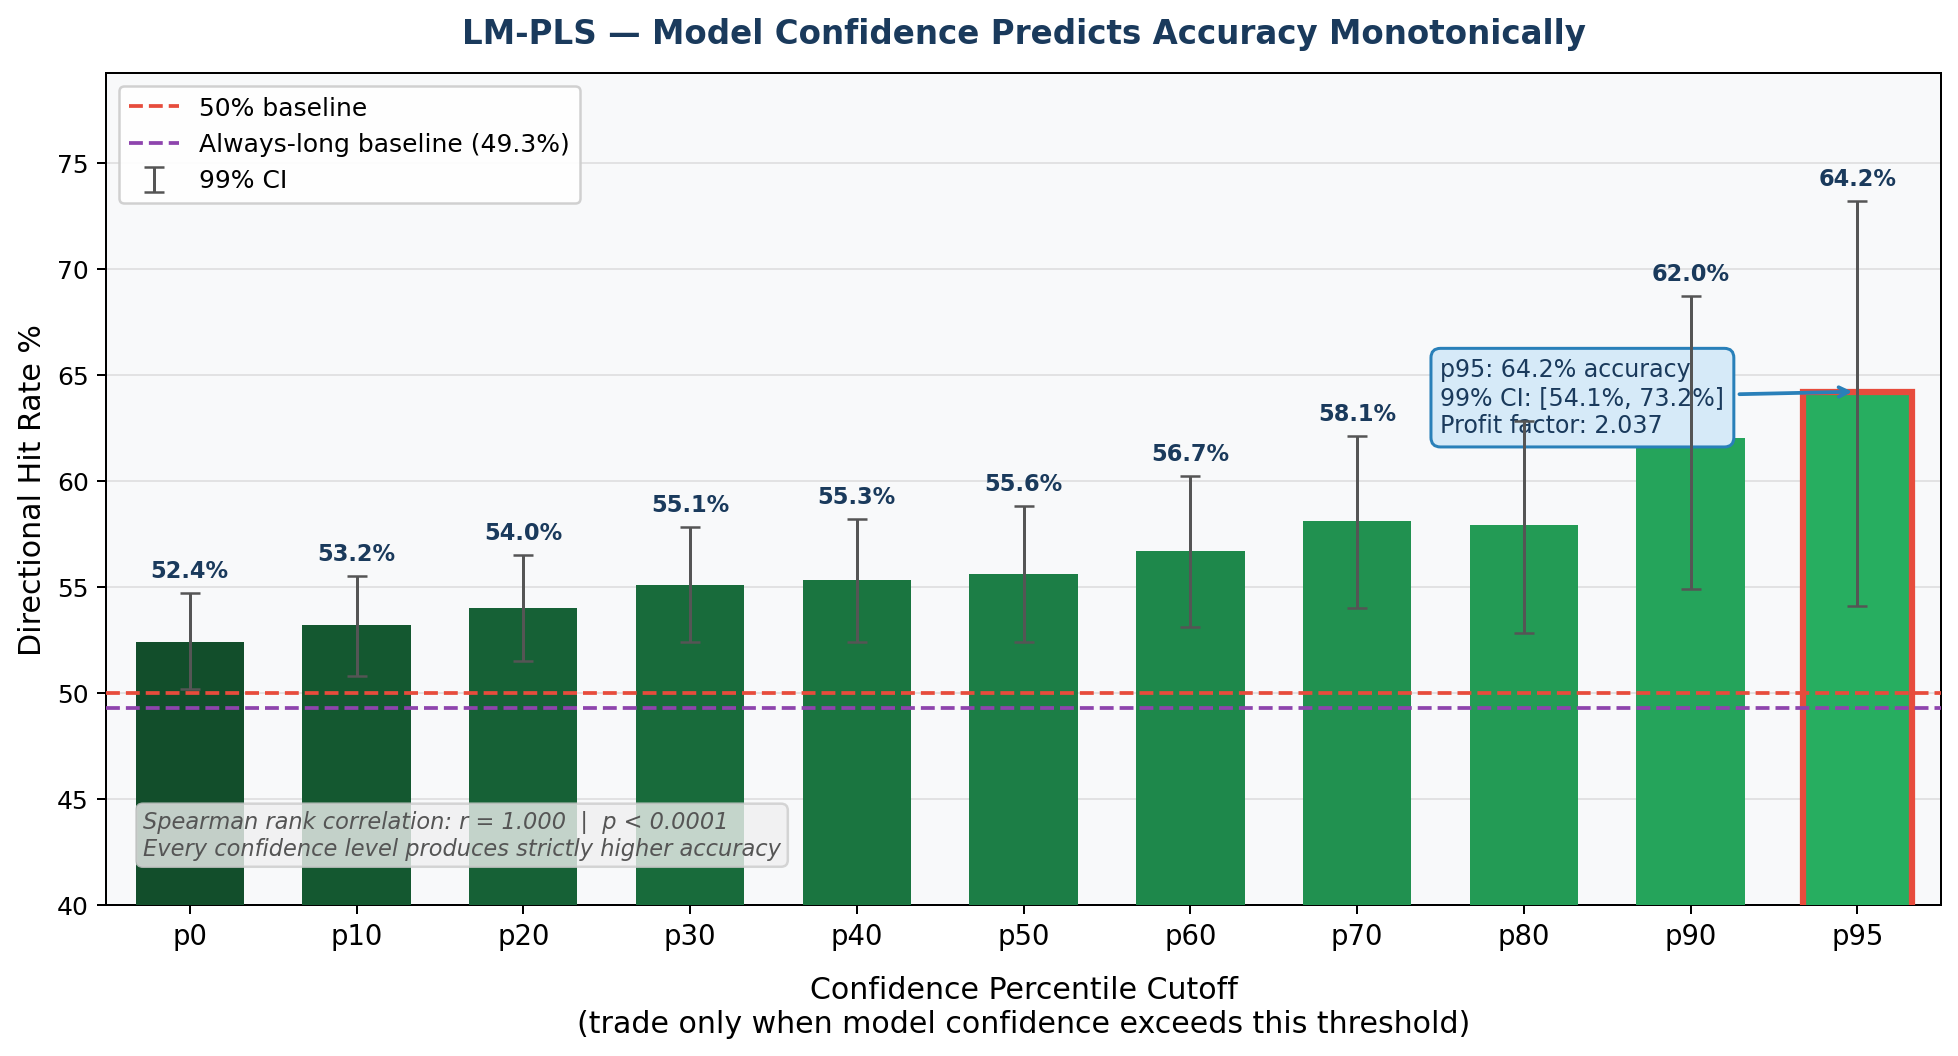
A second model was trained exclusively on hours preceding large market movements and applied to the same test set. The top 5% of its confidence scores achieved 64.2% accurate, but had a much larger total gain. Even though this model was less accurate, it was better at predicting larger market movements. This indicates that the vector direction representing large market movements could be meaningfully distinct from the one encoding general market movements, and that the two signals can be separated in embedding space.
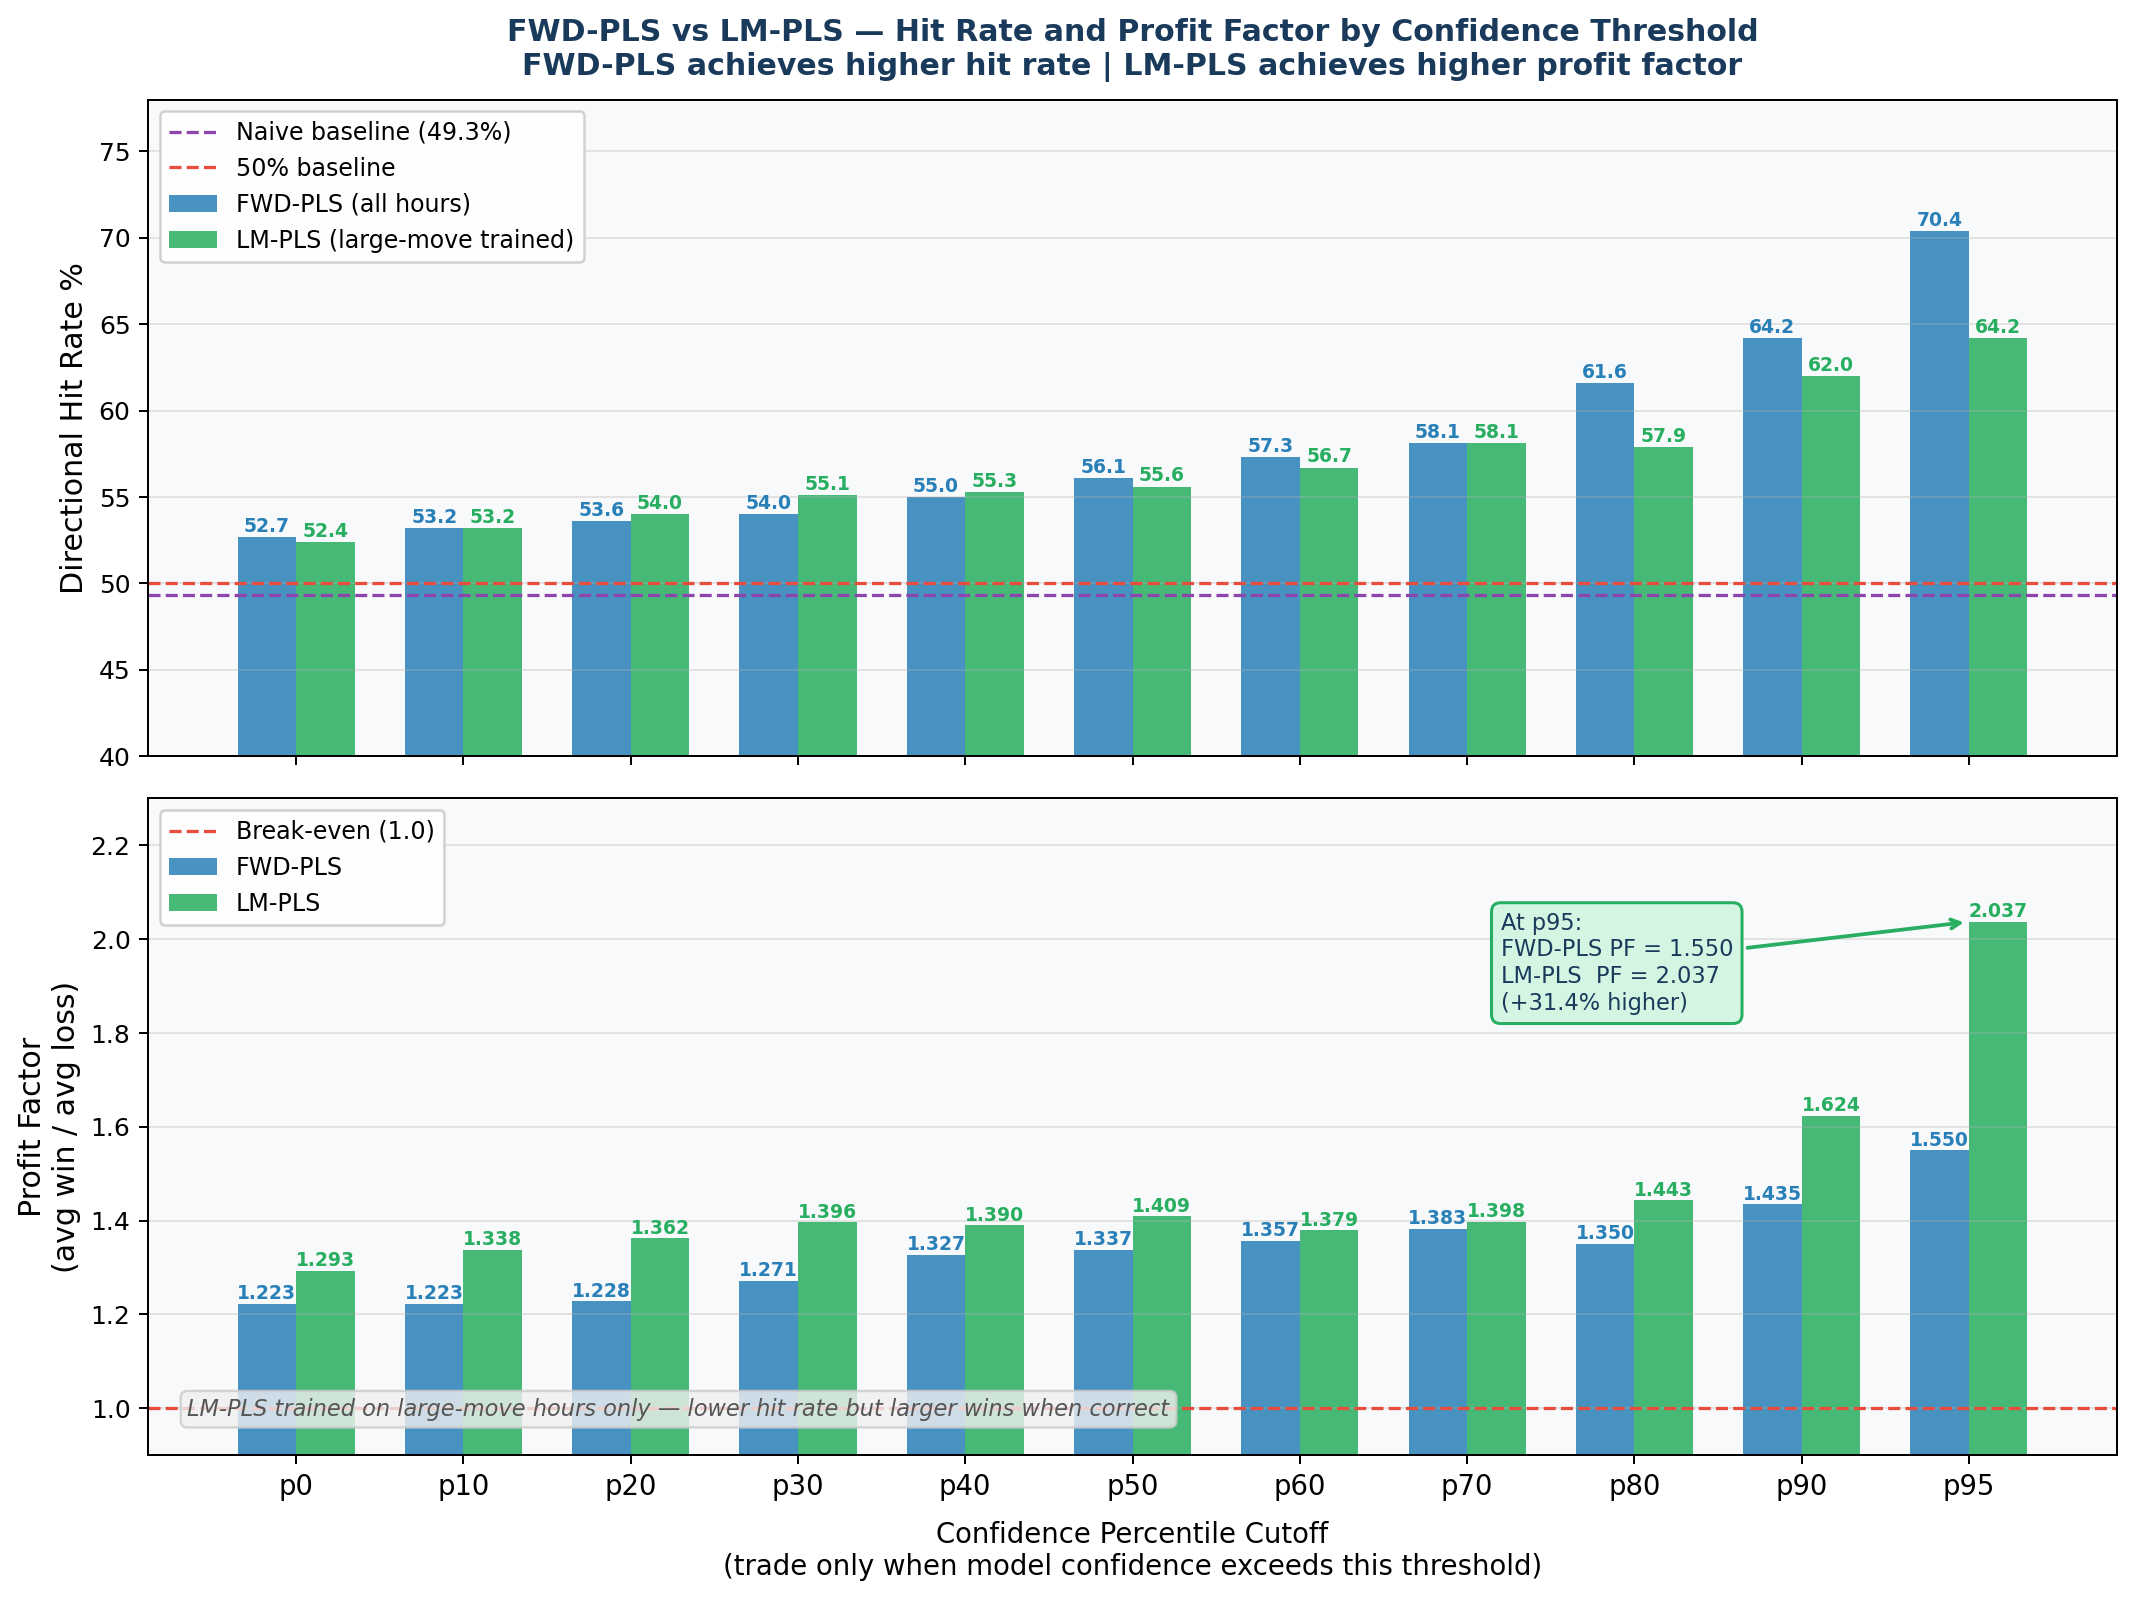
Even though the original model had a higher hit rate, if we calculate the expected profit from trading BTC with both models, the large movement model collects significantly more profit, despite being correct less often. At the top 5% confidence threshold, the LM-PLS model achieves a profit factor of 2.037 compared to 1.550 for the FWD-PLS model, meaning for every dollar lost, it returns $2.04 and $1.55 respectively.
Significance Testing:
To confirm the signal holds across different market regimes rather than being specific to one bull or bear run, the model was validated across five chronological folds spanning the full dataset. Each fold retrains on all prior data and tests on the next block of approximately 208 large-move hours. All five folds achieved statistical significance: 59.1% (p=0.005) during the early bull market, 64.9% (p<0.001) during the mid-bull run, 72.6% (p<0.001) at the ATH period, 69.2% (p<0.001) during the 2022 crash, and 63.5% (p<0.001) in the post-crash period, with a mean accuracy of 65.9% across all folds.
 Fold   Train_N  Test_N     Acc    Binom_p   Sig Test_Period
------------------------------------------------------------
    1       800     208   0.591     0.0051    **  2021-05-28 → 2021-07-19
    2     1,008     208   0.649     0.0000   ***  2021-07-19 → 2021-10-15
    3     1,216     208   0.726     0.0000   ***  2021-10-15 → 2022-01-24
    4     1,424     208   0.692     0.0000   ***  2022-01-24 → 2022-05-10
    5     1,632     208   0.635     0.0001   ***  2022-05-10 → 2022-06-30
Granger-causality test shows bidirectional causality, which is the expected result in this literature. However in conjunction with the pure momentum model hitting 75% accuracy, it begs the question if the reactive behavior of sentiment has just created a predictor based on momentum. Unfortunately, the dataset we have is one of the most volatile crypto markets in history, so we can’t rule out the possibility that the model is using reactive data to predict price movements until the model is tested on more stable market data.
Conclusion
Collective sentiment embedded in crypto Twitter contains a statistically significant directional signal for Bitcoin price movements based on this dataset. The central finding is that the PLS projection magnitude (model confidence) scales monotonically with directional accuracy across all threshold levels, achieving a 70.4% hit rate at the top 5% of confidence scores. This suggests that collective linguistic patterns in social media encode directional information about future price movements in a geometrically separable form within embedding space, extending the eigenmoods framework of ten Thij, Wood, Rocha & Bollen (2019) from lexicon-based emotion dimensions to the richer semantic geometry of large language model embeddings. Whether this signal reflects genuine crowd anticipation of market moves or a delayed reflection of momentum through social language remains an open question, as the reactive nature of sentiment and the characteristics of this particular dataset prevent a clean separation of the two mechanisms. In the future, this model will need to be tested on different markets using the same training data to test if the findings from this dataset can be generalized to other market archetypes.